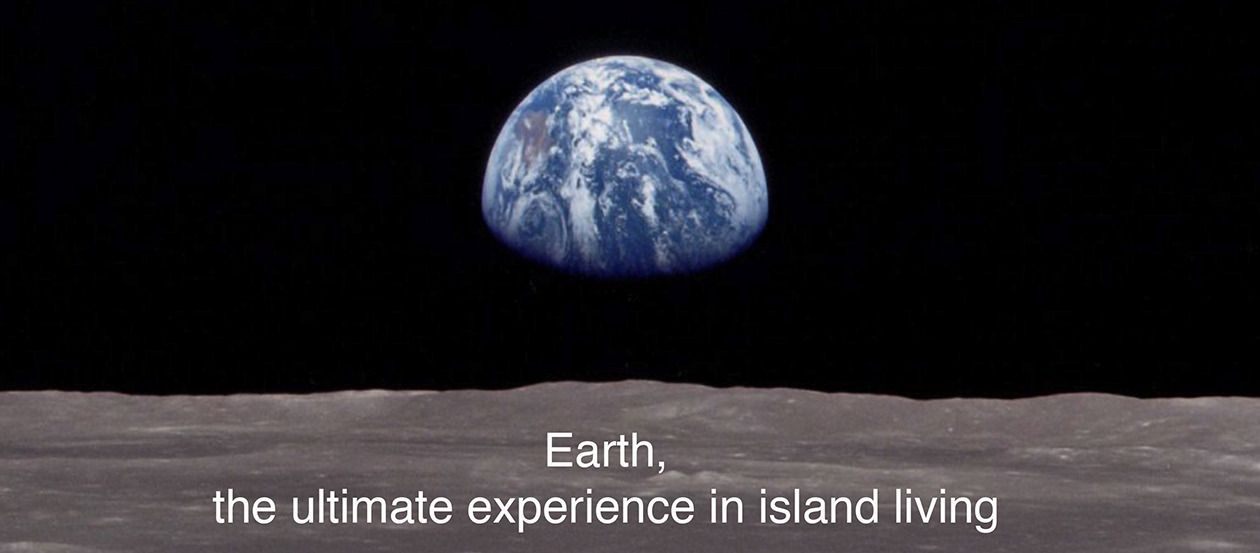
Comparing data from today with the 1st (2015) Quartermaster’s Report (QMR) published in the book “this Spaceship Earth” by David Houle and Tim Rumage.
The Quartermaster supervises, stores, and distributes supplies and provisions. The Quartermaster is also the one responsible for making sure equipment, materials, and systems are available and functioning. The purpose of the Quartermaster’s Report is to put forth the data that describes the status of the ship, in this case “This Spaceship Earth.” The reason for taking a planetary perspective is to realign our individual viewpoints and assumptions about resource quantity, quality, and demand with that of TSE’s current operational capability, capacity, and actual status. This is not about what is preferred or desired, but what is. Therefore, in the world of the Quartermaster, if a 16 oz. glass has 8 ounces of liquid, the glass is neither half full nor half empty – it simply has 8 ounces of liquid.
Human Population
2016 – 7,448,116, 815 people
2015 QMR – 7,307,492,161
net increase 140,624,654
http://www.worldometers.info
(the net increase is approximately the combined populations of the Tokyo, Delhi, Shanghai, Mumbai, Beijing, New York City, and Calcutta metropolitan areas.)
http://www.infoplease.com/ipa/A0762524.html
Net population increase
2016 – 159 people/min
2015 QMR – 148 people/min
net increase 11 people/min
http://www.worldometers.info
Food Waste
2016 1,600,000,000 tons
1st QMR 1,300,000,000 tons
net increase – 300,000,000 tons
It takes 250,000 billion liters (66,043 billion gallons) of water,
1.4 billion hectares (14 million sq. km. or 3.5 billion acres or 5.5 million sq. mi.) of land,
and 3.3 billion metric tonnes (3.6 US tons) of CO2 emissions to generate this food waste which has a global economic value of US$750, 000,000,000.
http://www.foodisforeating.org
Temperature
July 2016 was the hottest July ever recorded globally in 136 years of modern record keeping. July continued a streak of ten consecutive months (since October 2015) that have set new monthly high-temperature records.
http://earthobservatory.nasa.gov/IOTD/view.php?id=88607
Gavin Schmidt, director of Nasa’s Goddard Institute for Space Studies, said. “It’s unprecedented in 1,000 years. There’s no period that has the trend seen in the 20th century in terms of the inclination (of temperatures).”
Climate
Global Anthropogenic CO2 Emissions
from fossil-fuel combustion and industrial processes
2014 – 35,900,000,000 tonnes*
2012 – 34,500,000,000 tonnes (data used for 1st QMR)
net increase 1,400,000,000 tonnes
*http://www.globalcarbonproject.org/carbonbudget/15/files/GCP_budget_2015_v1.02.pdf
Translation Equivalency – global anthropogenic CO2 emissions measured in units of 4 tonne Elephants launched into the air/second /year
2014 – 284 elephants/second
2012 – 273 elephants/second
net increase 11 elephants/second
Annual Average Atmospheric Concentrations of CO2
in parts per million (ppm)
2015 – 400.83 ppm
2014 – 398.61 ppm
2013 – 396.48 ppm
2012 – 393.82 ppm
https://www.co2.earth/annual-co2
preindustrial levels ~ 278 ppm
net increase ~122 ppm, ~ 143% increase in CO2 concentrations
http://www.esrl.noaa.gov/gmd/ccgg/trends/history.html
Earth Overshoot Day comes earlier
2016 – 8 August
1st QMR – 13 August
net change – 5 days earlier
Earth Overshoot Day marks the date when humanity’s demand for ecological resources and services in a given year exceeds what Earth can regenerate in that year. Minimum safe date for balancing demand with resources and services is December 31st.
http://www.overshootday.org
World’s Ecological Footprint rises to 1.6 Earths
2016 – 1.6 planets
1st QMR 1.56 planets
net increase .04 planets
Today humanity uses the equivalent of 1.6 planets to provide the renewable resources we use and absorb our waste. This means it now takes the Earth 19.2 months to regenerate what we use in 12 months
http://www.footprintnetwork.org/en/index.php/GFN/page/world_footprint/.
Fish Stocks (overexploited/depleted/fully exploited)
2016 – 89.9%
1st QMR 87.0%
net increase 2.9%
http://www.fao.org/3/a-i5555e.pdf
Quartermaster’s Additional Considerations
Changes in Land Surface
In the past 30 years
115,000 sq. km (44,000 sq. miles) of land is now covered in water and
173,000 sq. km (67,000 sq. miles) of water has now become land.
The increase in land covered by water is due to sea level rise, the reservoirs that result from damming rivers, and the melt of glaciers thus turning them into lakes.
The two leading causes of increased land area are the drainage of lakes/inland seas and creation of artificial islands for real estate development and territorial claims.
http://www.nature.com/nclimate/journal/v6/n9/full/nclimate3111.html
or
http://www.bbc.com/news/science-environment-37187100
Subsidence: The gradual caving in or sinking of an area of land
Due to over pumping of ground water, many coastal cities are subsiding (sinking) faster than sea level is rising.
https://www.deltares.nl/en/topdossiers/subsidence/
Extinction Rate:
Extrapolating from the UN Environment Programme estimate, 54,750 – 73,000 species go extinct per year.
According to the UN Environment Programme, the Earth is in the midst of a mass extinction of life. Scientists estimate that 150-200 species of plant, insect, bird and mammal become extinct every 24 hours.
https://www.cbd.int/doc/speech/2007/sp-2007-05-22-es-en.pdf
Or
https://www.theguardian.com/environment/2010/aug/16/nature-economic-security
Submitted by
Tim Rumage
Co-author, This Spaceship Earth
Co-founder, thisspaceshipearth.org
Chief Science Officer and Quartermaster – This Spaceship Earth
There are two questions you might consider as you review this update.
First – how well do your assumptions about each topic match the reality of the data?
Second – does the information reflect an outcome that you wish humanity to achieve?
Your reflection and your response to your answers of those two questions will determine your consciousness and participation in defining and creating our common future.